
Exploring MTA Turnstile Data
Introduction
This blog is built on my first data science project at Metis/Chicago, working together with Zach Heick and Eric Chan.
Background
Our client, WomenTechWomenYes (WTWY), will host an annual gala fundraising event at the beginning of summer next year in New York City. They want to place their street teams at entrances of subway stations and distribute posters to advertise this event. The objective of this project is to isolate popular subway stations to maximize the potential attendees to the fundraising event.
Approach
Raw data and tools
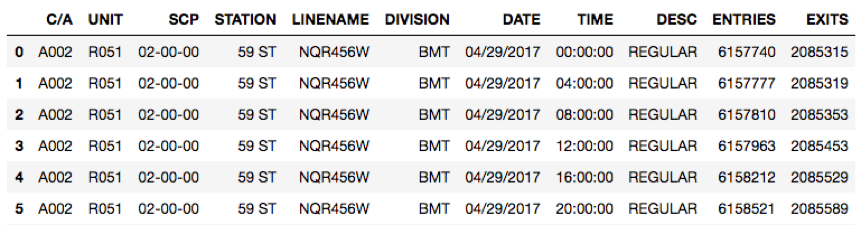
- The main data set we used is the MTA turnstile data, which shows the entries and exits for each turnstile device at subway stations in NYC. The raw data was shown with a screenshot in Figure 1 below. For each device, entries and exits were documented accumulatively every 4 hours.
- The other source of data is the housing value from Zillow. It is assumed that the housing price indicates the ability and likeness of donations.
- The main tools used are pandas (data exploration) and matplotlib (plotting and visualization), both implemented in Python.
Data Manipulation and Visualization
We analyzed net entries of line & station combinations over time and cleaned the data by removing unrealistic spikes (possibly caused by the counter reseting).
Results & Discussion
Pick a station
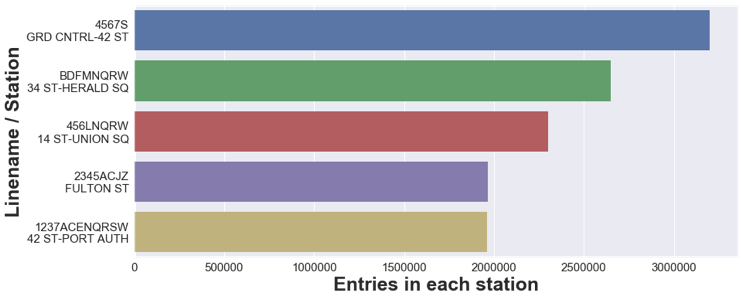
First of all, we summarize the riders for each station, as shown in Figure 2. Such figure indicates that busy stations are mostly located in manhattan.
Pick a time
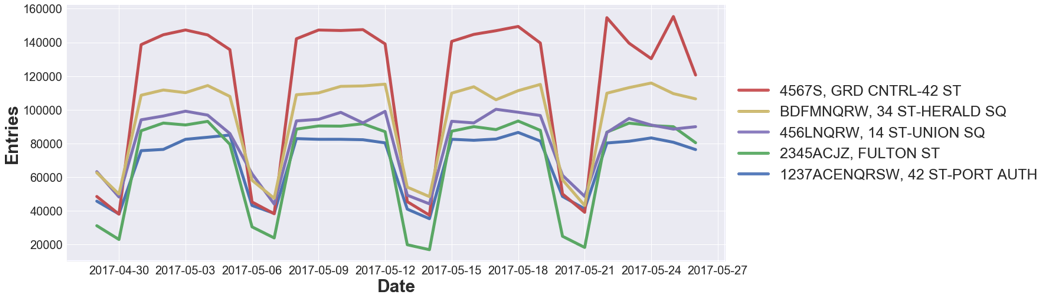
Besides identifying popular stations, we plot out the variation of entries over time, as indicated in Figure 3 below. The weekdays (represented by the wide peaks) have more riders that the 2-day weekends (narrow valley). We would suggest weekdays for the flyer distribution.
Cross-reference with Zillow data
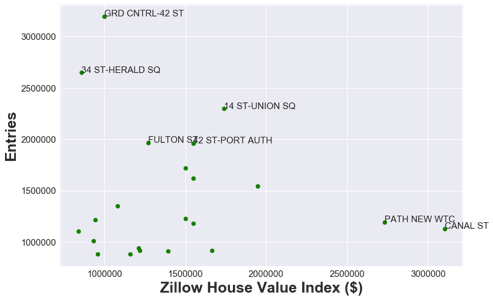
Figure 4 below reveals the housing value against subway entries. Considering the combinations of the number of potential guests (how many people would donate) and economic capabilities (how much money would they donate), 14 ST at Union Square and 42 ST-Port AUTH stand out.
Conclusions
We suggest following three stations:
- 14 ST at Union Square
- 42 ST-Port AUTH
- Grand central
Top two are the best combinations of subway entries and housing values. Grand Central Station would be also recommended as it is the busiest station with most riders.
Further considerations
In order to further improve the accuracy of prediction with the data science knowledge, there are several additional factors we could consider.
- Station: For example, subtracting the tourist riders would lead to better results. Furthermore, those stations close to the gala host place could be suggested with a high confidence (probably by adding a weighting coefficient).
- Time: We suggest weekdays with more riders than the weekend, but people taking the subway during the rush hour are probably less patient to look at the poster.
- Other data: Last but not least, there are more relevant data sources, which could be helpful in future prediction. For example, private data from WiTNY - Women in Tech New York (> 1,000 members!) could be very insightful and help narrow down and navigate to the ideal attendees to this specific event.
References
- Front image: www.nycedc.com